
What it is
A real-time view of performance, for students and instructors alike
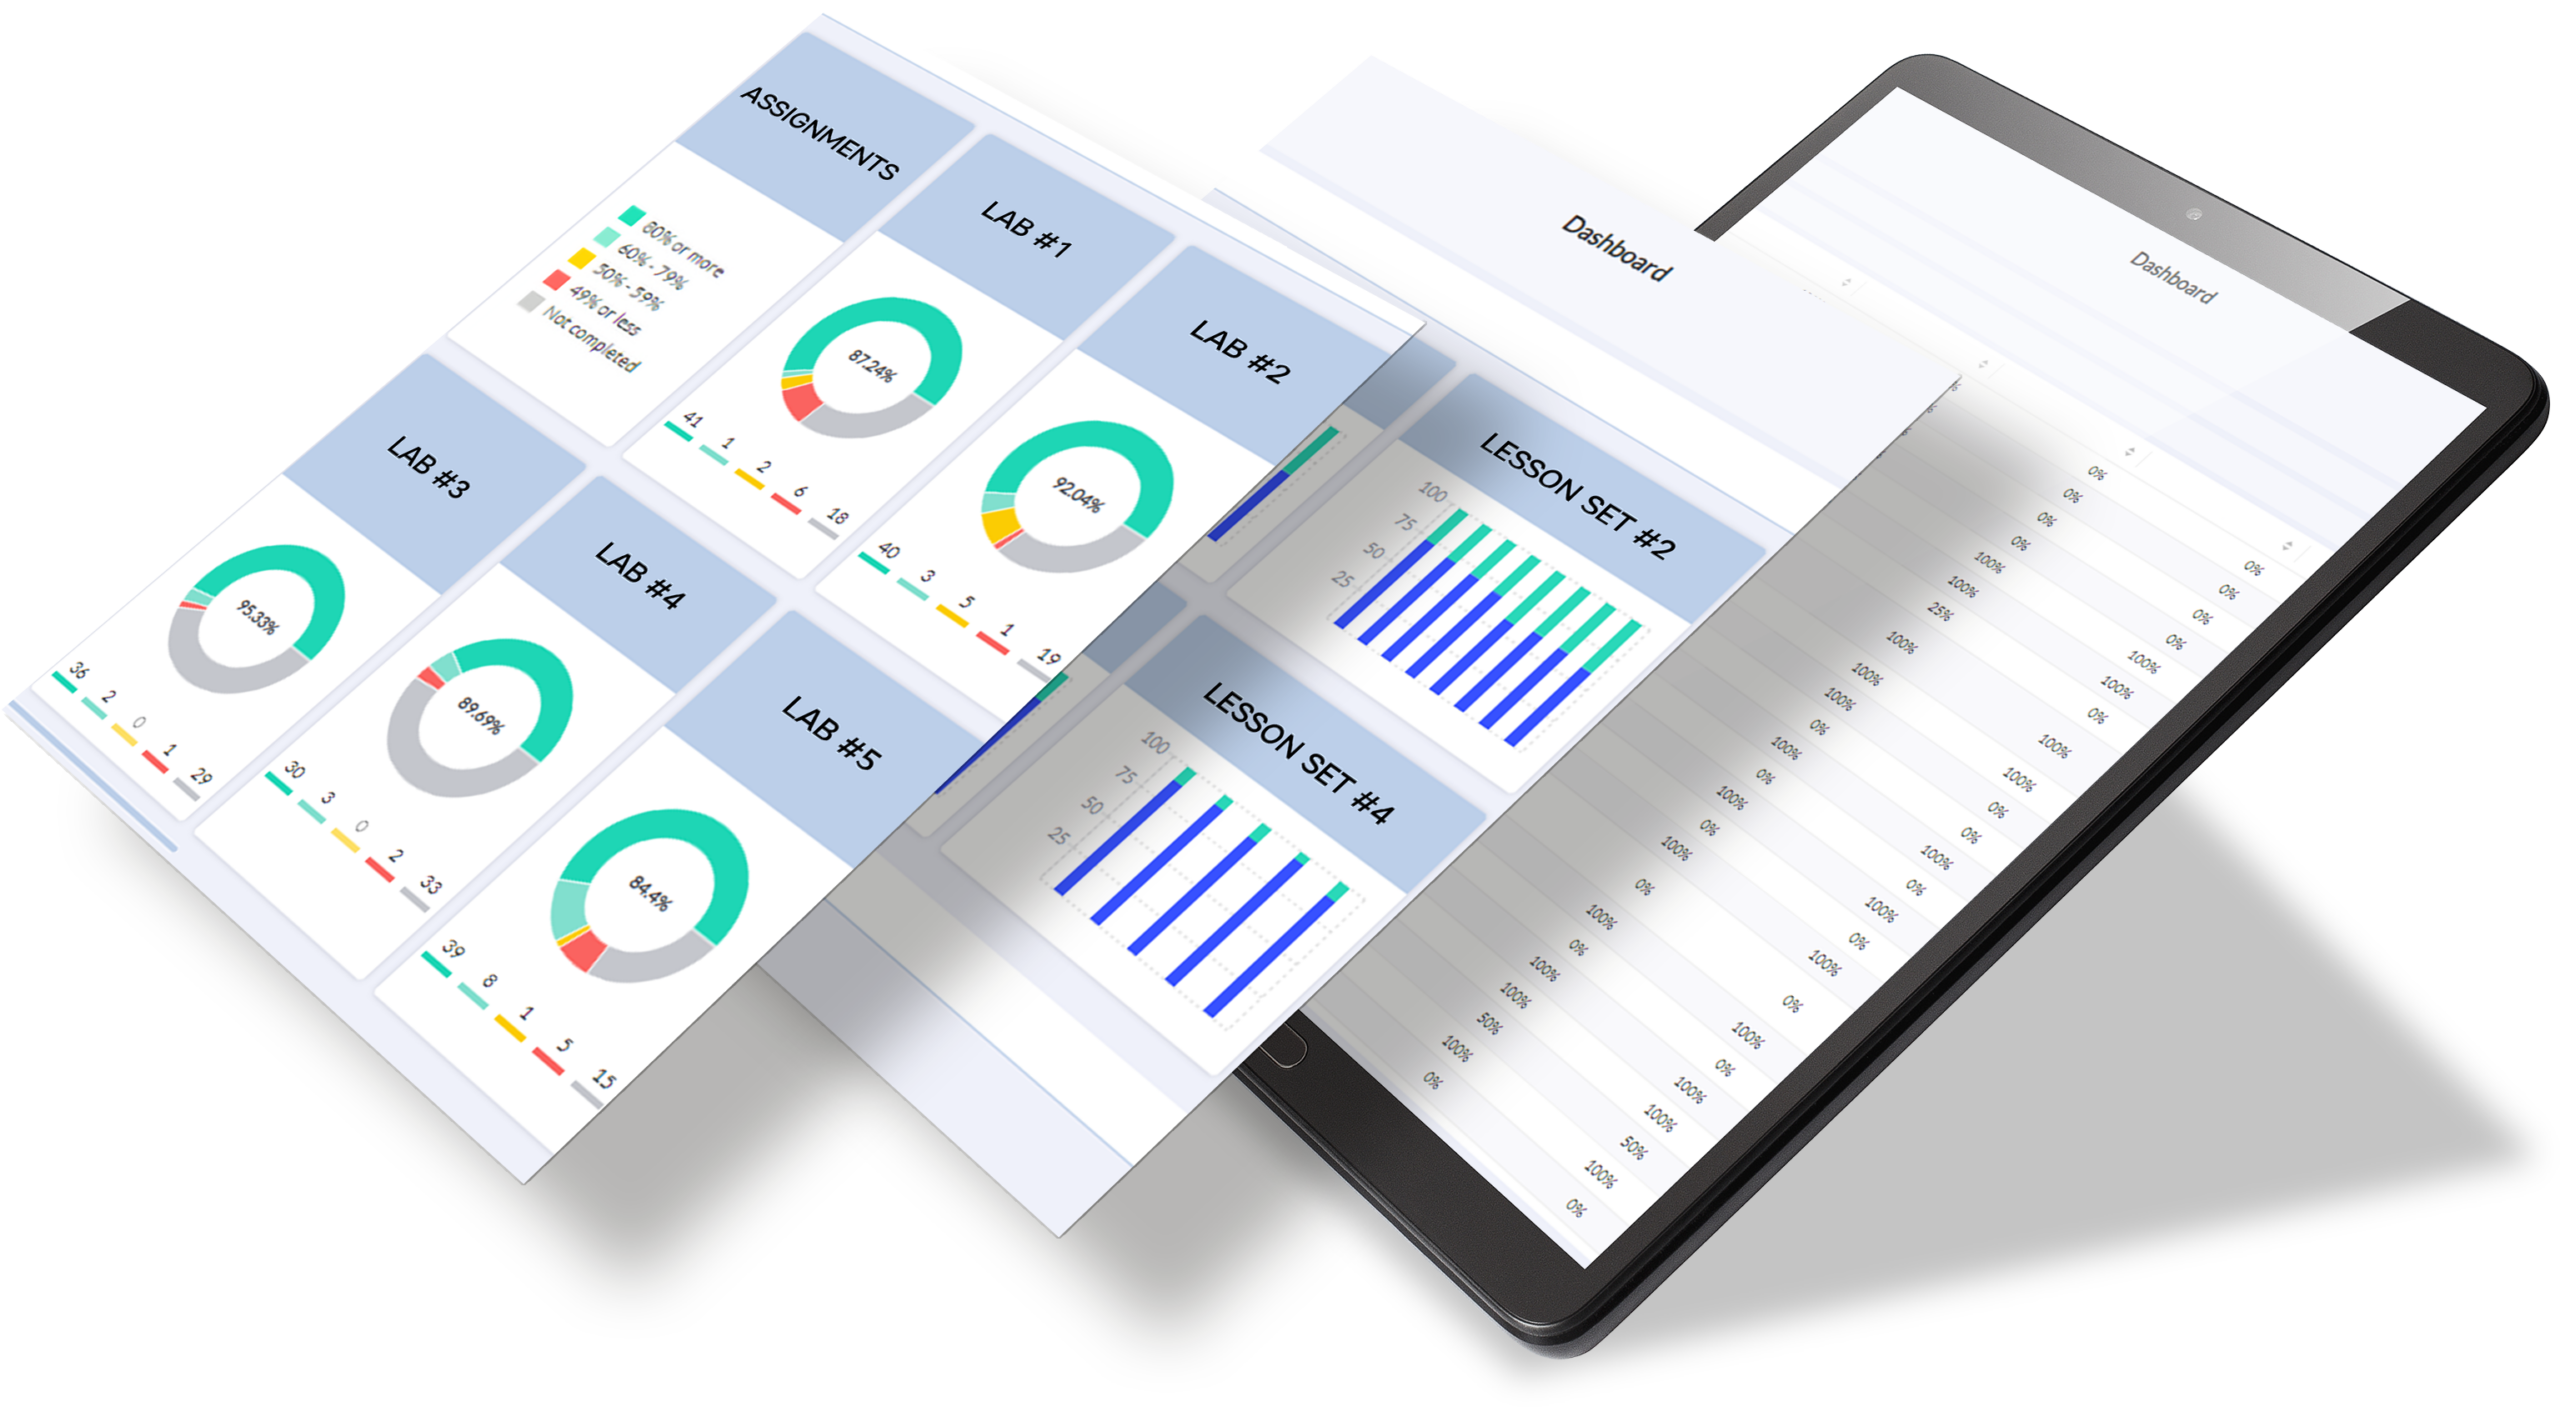
HLS dashboards present data from connected lessons and assessments through clear, visual views of individual and class performance – including chapter and lesson completion, assessment marks, question-level results, and individual submissions.
Instructors use this information to identify concepts that need more attention and adjust their in-class focus. Students use it to recognize their strengths, pinpoint what needs more practice, and study more efficiently.
Who it helps
Built for students, instructors, and institutions
For Students
Students can see chapter completion and lesson-by-lesson progress, along with marks on assignments, tests, and exams. This gives students a clearer understanding of the concepts they have mastered and the areas that may require additional practice.
For Instructors
Instructors can view average completion and mark data by chapter, assignment, or question, including individual student submissions, to see exactly where a student or class is struggling, and adjust in-class focus accordingly.
For Institutions
HLS dashboards support digital and hybrid course delivery by connecting student activity with clear progress and performance information. Where supported, grades can also be exported or synchronized with the institution’s learning management system.
Capabilities
What HLS dashboards can support
Real-time individual and class performance views
Instructors can view the performance of individual students as well as overall class results, helping them understand how students are progressing through the course.
Lesson and chapter completion tracking
For resources that include interactive lessons, dashboards display average chapter completion and lesson-by-lesson percentages for the class, while students can track their own progress through course content.
Assessment performance breakdown
Dashboards show average and highest marks by assignment, test, or exam, as well as performance on individual questions, helping pinpoint the exact concept students are finding difficult.
Question-level and submission review
Instructors can review individual student submissions question by question, and override marks directly where needed.
Mark review, grade export
Instructors can review or override marks, export grades to a spreadsheet, or synchronize grades with the institution’s learning management system.
Resource ecosystem
How dashboards connect with other HLS resources
Dashboards are part of a broader HLS learning ecosystem. They work alongside e-Textbooks, interactive lessons, and assessments to connect course content and student activity with clear progress and performance information.
e-Textbooks
Course explanations, examples, and practice materials give students content they can review alongside their dashboard results.
Lessons
Guided digital lessons help students work through concepts in smaller learning steps, while connected dashboards provide visibility into lesson and chapter completion.
Assessments
Customizable online assignments, quizzes, tests, and exams generate performance information that students and instructors can review through connected dashboards.
Marketplace connection
Explore resources that include performance dashboards
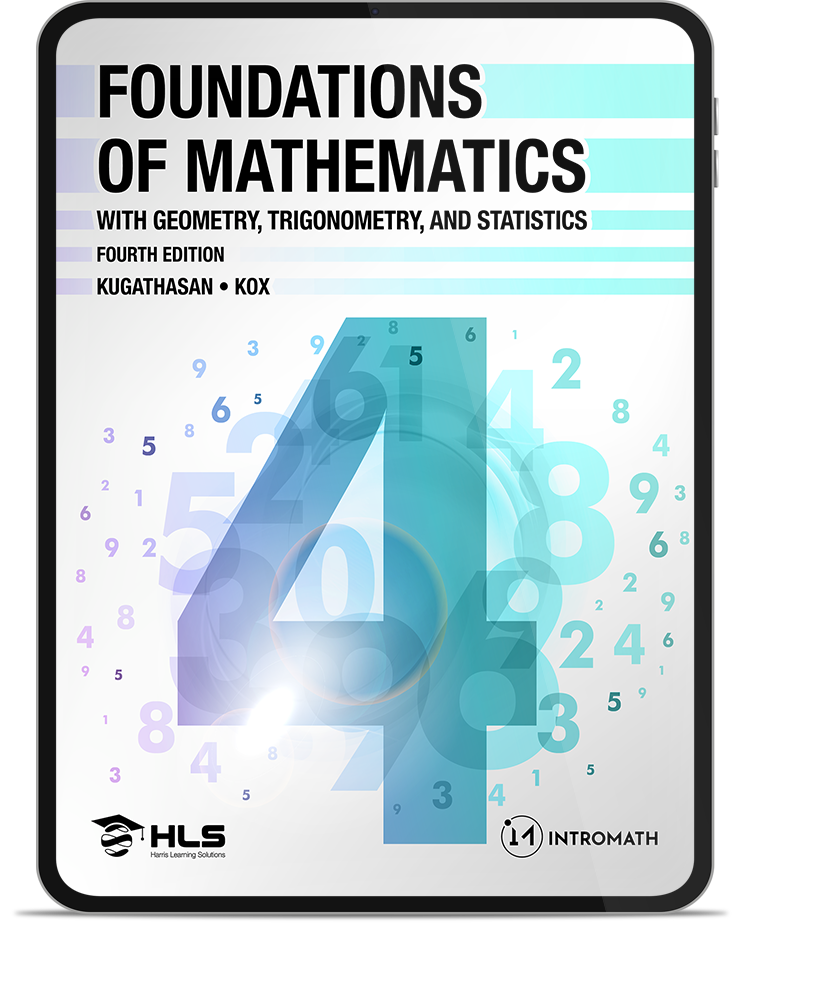
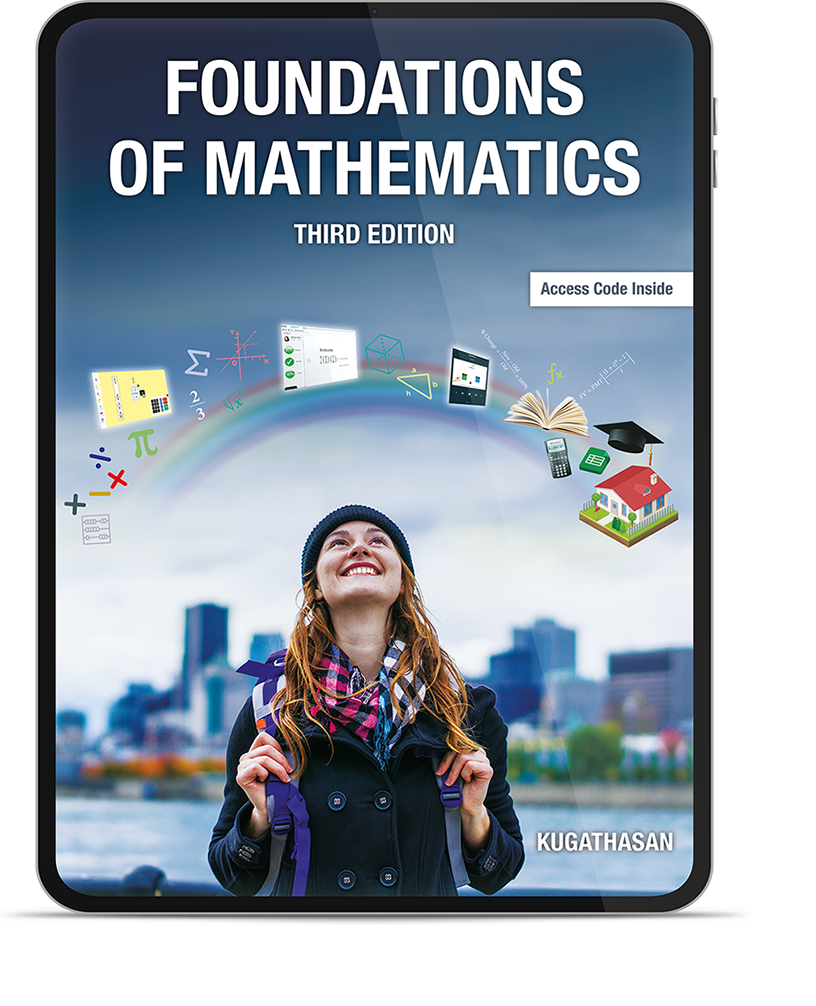
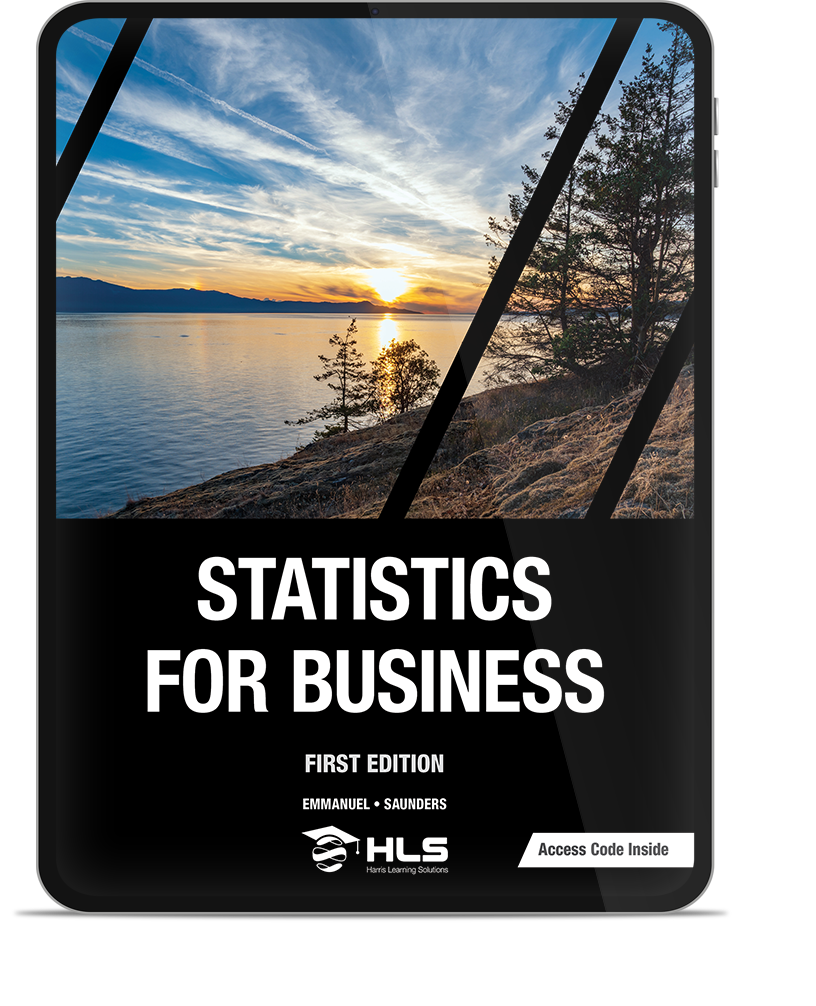
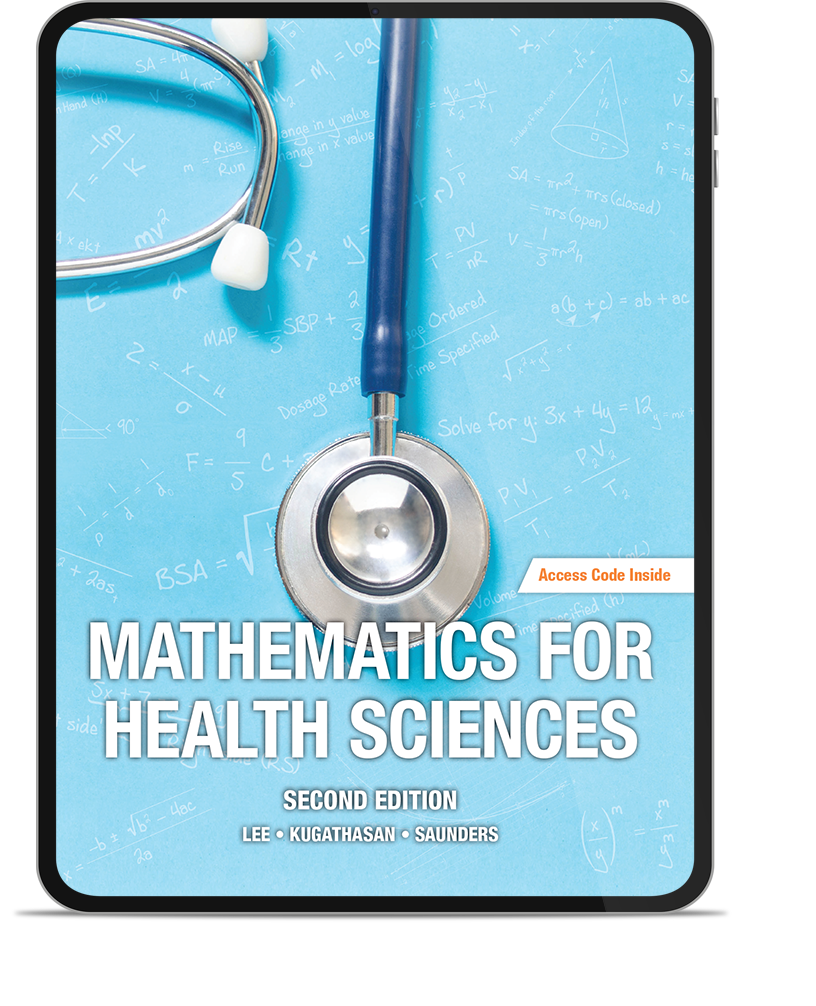
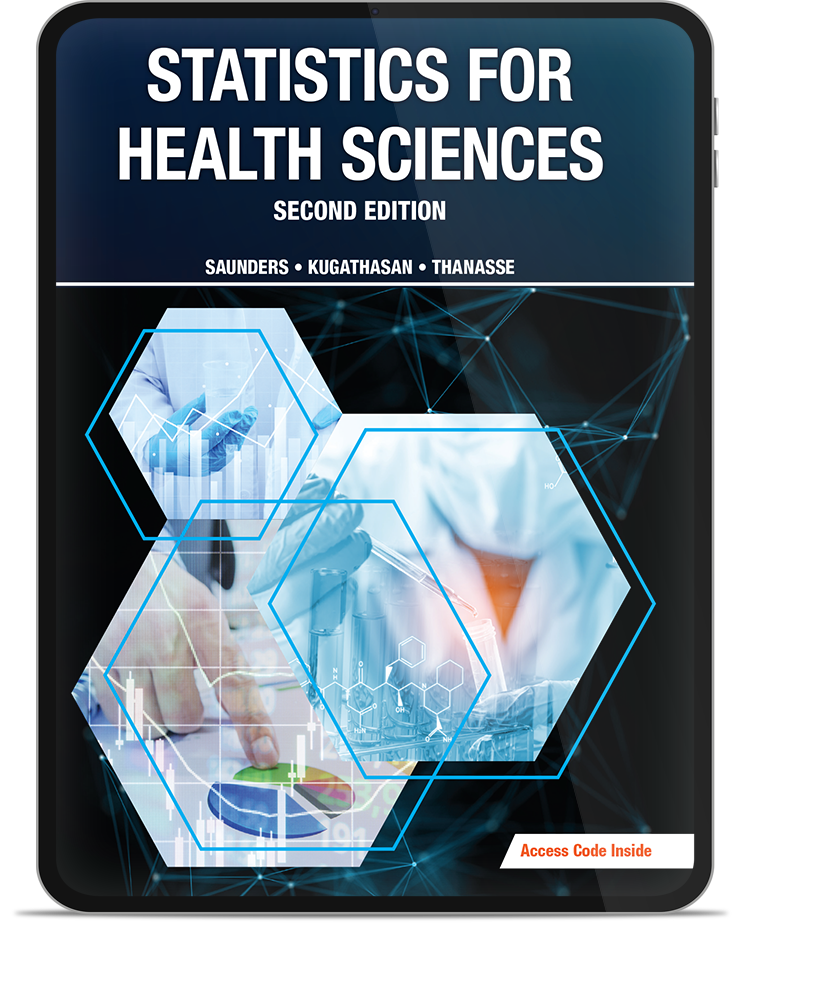
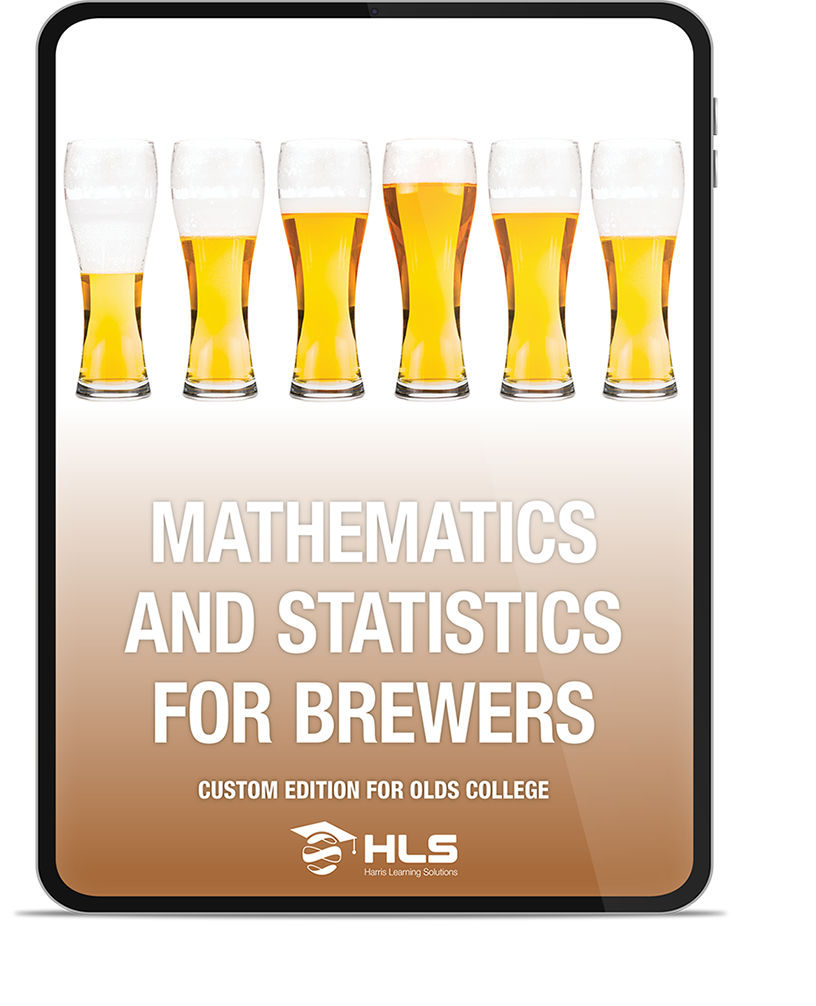
Browse HLS digital and hybrid learning resources that combine course content, interactive lessons, assessments, and real-time dashboards for viewing individual student and overall class performance.
Dashboards



Ready to explore HLS performance dashboards?
Discover HLS resources that give students and instructors clearer visibility into lesson progress, assessment results, and individual or overall class performance.